
Measurement Scales in SPSS

                                      MMeasurement Scales in SPSS


1.Nominal:
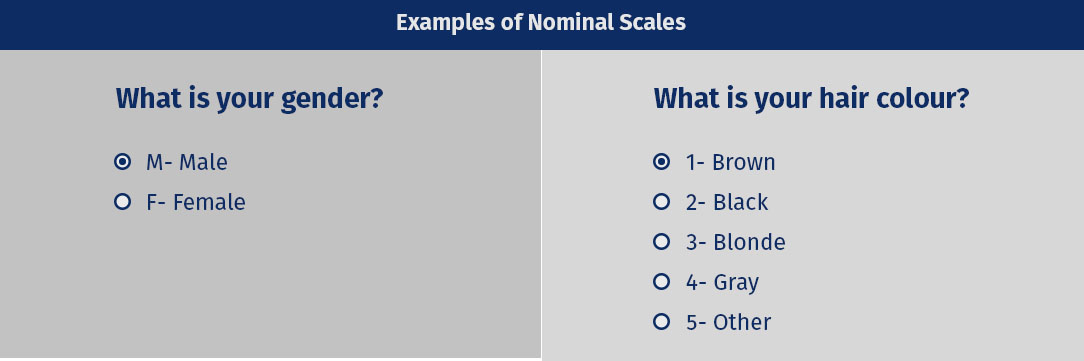
It is measurement scale in which numbers are used as "tags"or "labels" which is used to classify an object.It deals with non-numeric variables.It is used for the purpose of classification. for example, in case of gender scale,it can be classified as Male=1 and Female=2. It is used for only for counting purposes.

nominal scale example

2.Ordinal:
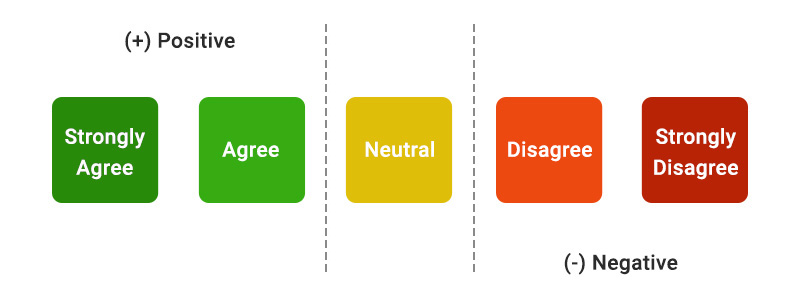
It is the second level of measurement in which ranking of data without actually establishing the degree of variation between them.


  • Likert Scale through which we can measure the order.

Liker Scale Example
Scale:
Divided into two parts:
1. Interval Scale
2. Ratio Scale

1.Interval Scale:
In this measurement variables are measured in exact manner not in relative manner.

Example:

  • Likert Scale
  • Net Promoter Score(NPS)
  • Bipolar Matrix Table
2.Ratio Scale
It allows researchers to compare the differences or intervals. The ratio scale has a unique feature. It possesses the character of the origin or zero points.

Example:

An example of a ratio scale is:

What is your weight in Kgs?

  • Less than 55 kgs
  • 55 – 75 kgs
  • 76 – 85 kgs
  • 86 – 95 kgs


Comments

Popular posts from this blog

Cross-tabulation and How to measure chi-square in SPSS

                                                                      Cross-tabulation   It is used to measure the relationship in two categorical variables. It is used to measure the chi-square test. For measuring the chi-square test there are two conditions: 1.Variables should be measured in nominal or ordinal level. 2. Variables should contain two or more categorical or independent groups. For example, to teach statistics for undergraduates,educators have to know their auidence(male,female) and which mode of learning they want(online,offline).So,here two nominal variables gender and medium of learning. Steps how to do chi-square in SPSS using cross-tabulation: Step1:  Referring to the above examples, two variables are gender,medium of learning. Click  A nalyze > D e scriptives Statistics >  C rosstabs...  on the top menu, as shown below: Step 2: Following dialog-box of cross-tab will be open: Step 3: Transfer the variables into row and columns i.e in this case gender will be i

About ME

HEY! Everyone I am Rajat a passionate researcher love to analyze data statistics and interpret various research done previously. I created this blog in order to help the research enthusiast who want to learn statistics. You will learning the statistics from basic and step-by-step through analysis.  My Approach to Teaching Statistics I want to help you to learn statistics.But I am not telling, you to learn equation Don't get me wrong.Equations are necessary. I want you to learn true essence of statistics. I will help you to learn more about the graphs.However, I'' will focus on teaching in sequential manner.After all you will use statistical tool rather you don't have to remember the formulas. Why You Need to Understand Statistics The world is shifting more towards data-driven place,to draw come with insightful conclusion to a problem statement. Even if you are not performing statistical analysis how will trust the result of others true? This only happen when you know th

BASIC STATISTICS

STATISTICS It is science of  data which is mainly concerned with collection,organizing,analysis and interpretation of data by providing suitable conclusion. For eg. data from healthcare, data of company sales. Some terminology of Statistics: 1. Data: It is collection of meaningful information presented in proper format.                                                                                           1.Primary Data: The data which is collected by  directly asking the questions related to research to people or respondent  and recording the responses. Some research do this by going on ground and asking to respondent and collecting data.For e.g. Take the election exit-pool where the company asks voters whom they voted,collect all data and prepare necessary conclusion,then they sell their conclusion to various news agency whom they  had tie-up. 2. Secondary  Data: T he data which can be collected through other sources, as the company collect it from research or data-collection wh