
Cross-tabulation
It is used to measure the relationship in two categorical variables. It is used to measure the chi-square test. For measuring the chi-square test there are two conditions:
1.Variables should be measured in nominal or ordinal level.
2. Variables should contain two or more categorical or independent groups.
For example, to teach statistics for undergraduates,educators have to know their auidence(male,female) and which mode of learning they want(online,offline).So,here two nominal variables gender and medium of learning.
Steps how to do chi-square in SPSS using cross-tabulation:
Step1: Referring to the above examples, two variables are gender,medium of learning.
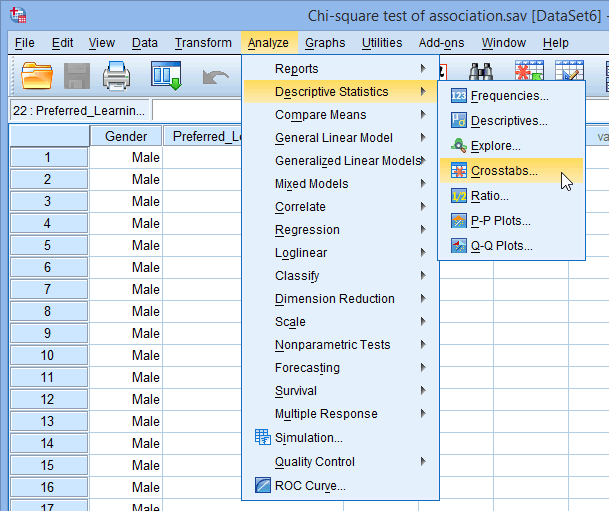
Click Analyze > Descriptives Statistics > Crosstabs... on the top menu, as shown below:
Step 2:
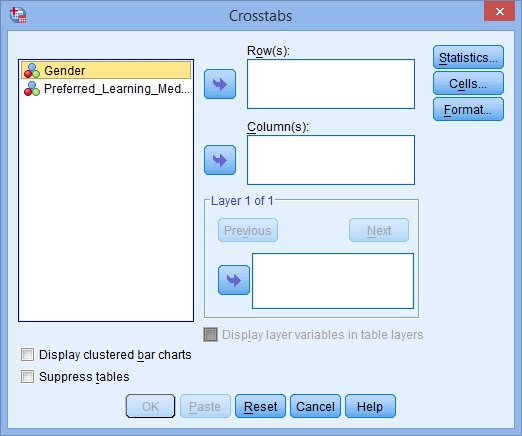
Following dialog-box of cross-tab will be open:
Step 3:
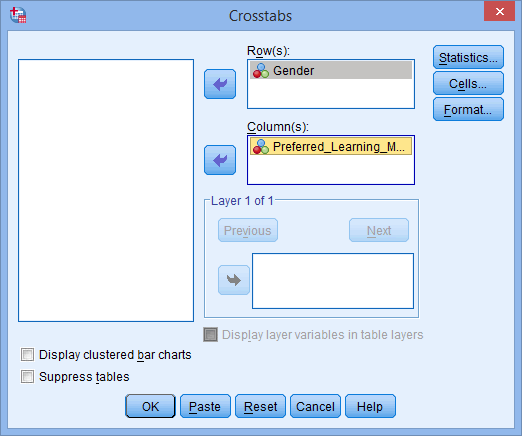
Transfer the variables into row and columns i.e in this case gender will be in row and mode of learning in columns.
Step 4:
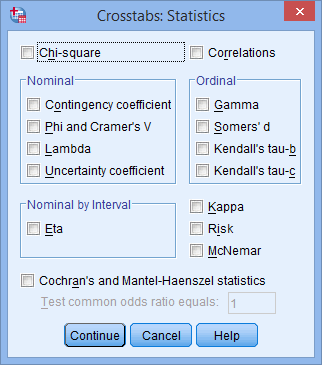
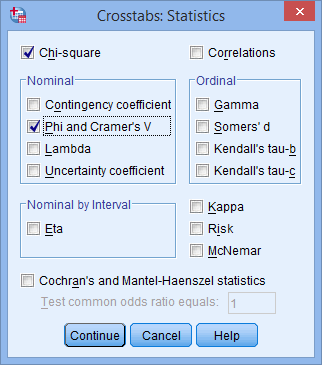
Click on statistics and dialog box will be opened.
Step 5:
Click on checkbox of chi-square and Phi and cramer's V.
Step 6:
Click on Continue.
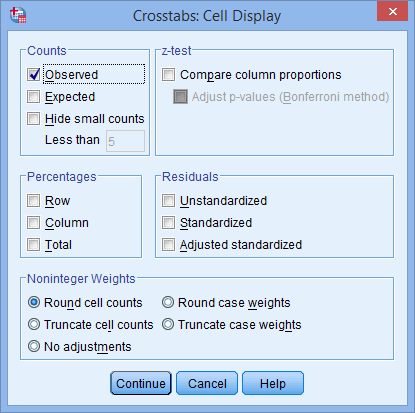
Step 7:
Click on Cells button.
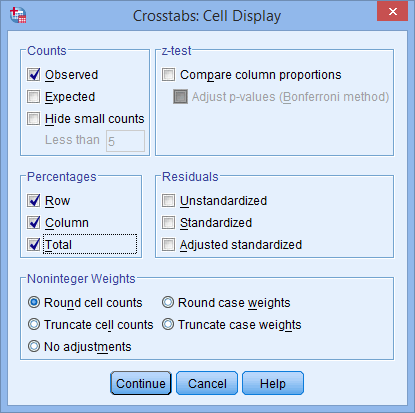
Step 8:
Click on observed,row,column,total.
Step 9:
Click on Continue.
Step 10:
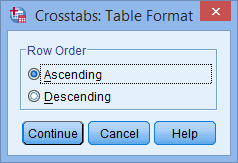
Click on format button.
Step 11:
Arrange in ascending,descending order.
Step 12:
Click on Continue.
Step 13:
Click on OK to generate output.
SPSS Output:
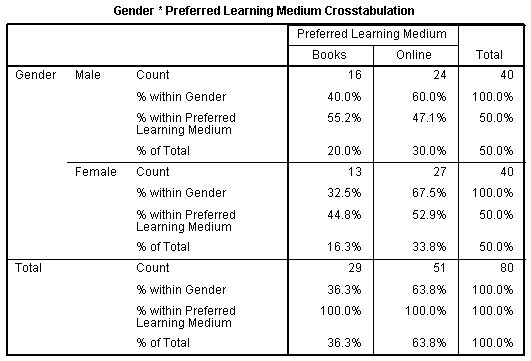
The Cross tabulation Table (Gender*Preferred Learning Medium Cross-tabulation)
This table allows us to understand that both males and females prefer to learn using online or offline.
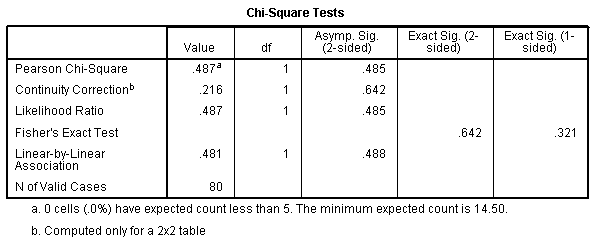
The Chi-Square Tests Table
When reading this table we are interested in the results of the "Pearson Chi-Square" row. We can see here that χ(1) = 0.487, p = .485. This tells us that there is no statistically significant association between Gender and medium of learning.
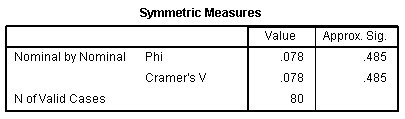
The Symmetric Measures Table
Comments
Post a Comment