
BASIC STATISTICS ---Mean,Median and Mode

MMEAN,MEDIAN AND MODE

In order to summarize your data, you can do this using two methods:
  1. Graphs.
  2. Central Tendency methods.
1. Graphs: Using various graphs we can easily summarize our data and get into the result.
2. Central Tendency Method: It represents the center point or typical value of dataset. It represents the data to cluster to a middle value.  

Measures of Central Tendency
It can be measured through three different:
1. Mean
2. Median
3. Mode

1. Mean:
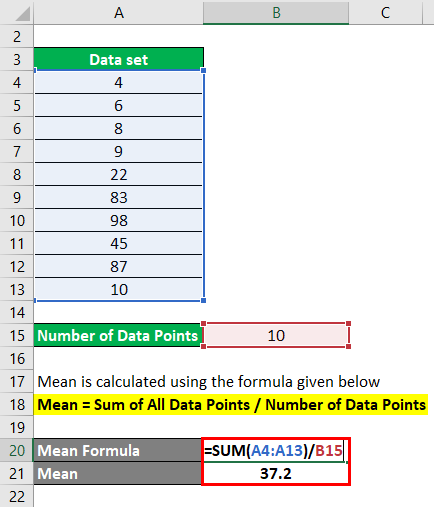
It is one of the common central tendency method used.It can used for discrete and continuous data.It is given by sum of all values of dataset divided by number of values in the dataset. So if we have n values in dataset and they have values like x1,x2,x3,x4 etc. 


Mean Formula – Example #1

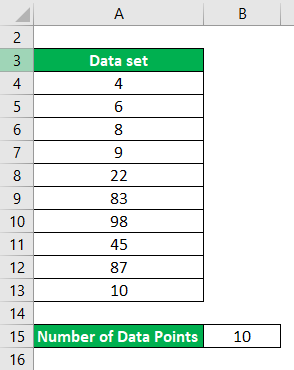
Let say you have a data set with 10 data points and we want to calculate mean for that. Data set : {4,6,8,9,22,83,98,45,87,10}

Data Set

Calculation of Mean Formula Example 1

2. Median:

The median is the middle score for a set of data that has been arranged in order of magnitude.Suppose we have the data below:

6555895635145655874592
We first need to rearrange that data into order of magnitude (smallest first):
143545555556 5665878992

Our median mark is the middle mark - in this case, 56 (highlighted in bold). It is the middle mark because there are 5 scores before it and 5 scores after it.

3. Mode:
Number which is occurring most often in a given set of dataset. for e.g. in {6, 3, 9, 6, 6, 5, 9, 3}
which the mode 6 which occur most. The  mode is 6.


Comments

Popular posts from this blog

Cross-tabulation and How to measure chi-square in SPSS

                                                                      Cross-tabulation   It is used to measure the relationship in two categorical variables. It is used to measure the chi-square test. For measuring the chi-square test there are two conditions: 1.Variables should be measured in nominal or ordinal level. 2. Variables should contain two or more categorical or independent groups. For example, to teach statistics for undergraduates,educators have to know their auidence(male,female) and which mode of learning they want(online,offline).So,here two nominal variables gender and medium of learning. Steps how to do chi-square in SPSS using cross-tabulation: Step1:  Referring to the above examples, two...

Measurement Scales in SPSS

                                       M Measurement Scales in SPSS 1.Nominal: It is measurement scale in which numbers are used as "tags"or "labels" which is used to classify an object.It deals with non-numeric variables.It is used for the purpose of classification. for example, in case of gender scale,it can be classified as Male=1 and Female=2. It is used for only for counting purposes. 2.Ordinal: It is the second level of measurement in which ranking of data without actually establishing the degree of variation between them. Likert Scale through which we can measure the order. Scale: Divided into two parts: 1. Interval Scale 2. Ratio Scale 1.Interval Scale: In this measurement variables are measured in exact manner not in relative manner. Example: Likert Scale Net Promoter Score(NPS) Bipolar Matrix Table 2.Ratio Scale It allows researchers ...