
SPSS: Beginners Tutorials

                        SPSS – What Is It


SPSS means “Statistical Package for the Social Sciences” and was first launched in 1968. Since SPSS was acquired by IBM in 2009, it's officially known as IBM SPSS.Generally it is used to analyze various types of data of sectors and most researcher uses this tool as it is open source anybody can use it for analysis purpose.

How to Read data in SPSS

It can be read through various sources:
1. Statistical file of SPSS.
2. Excel/CSV
3. Database Application
4. Text file

1.Reading Statistical file of SPSS.
Statistical files are saved with the .sav extension. following are the steps.
  1. Open the “Menu” and go to “File” option.
  2. Select “Open”.
  3. Click on “Data”.
  4. Search for the file sample.sav and open it.
  5. The Data Editor displays the data in the file.
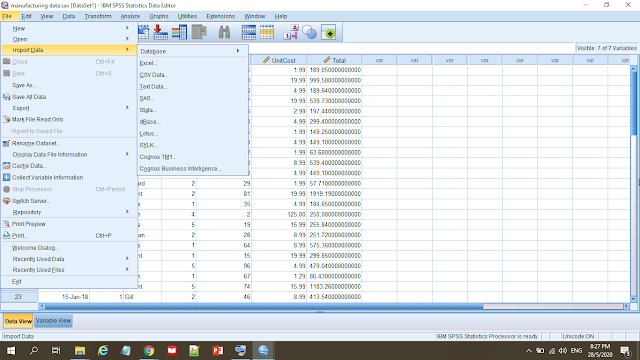
2.Reading data from Excel/CSV
1. Open the "Menu"  and go to "file" menu.
2. Click on Import Data.
3.Click on Excel/CSV

3.Reading data from Database Application
1. Open the "Menu"  and go to "file" menu.
2. Click on Import Data.
3.Click on Database.
4. select “New Query


3. 

Reading Data from a Database

  • Select “MS Access Database” from the list of data sources and click “Next”.
  • Note to consider: On the basis of your installation, on the left side of the wizard, there may be a list of OLEDB data sources, in this example, we are using the list of ODBC data sources which is displayed on the right side of the wizard.
  • Click on the “Browse” button to navigate to the Access database file and open it.
  • Open the file named ‘sample.mdb’.
  • Click “OK” in the login dialog box appeared on the screen.
  • After this, mention the tables and variables which you are supposed to import.

Reading Data from a Database

4. Reading data from text file
1. Open the "Menu"  and go to "file" menu.
2. Click on Import Data.
3.Click on Text file.

Reading Data from a Database


There are two types of Editor:
1.Data View
2.Numeric View

1.Data View
It is used to display the data in the file. In the Data editor, the information is displayed in the form of the variables and the cases.

  • In the Data View, variable are represented by the columns and on the other hand, cases are represented by the rows.
  • And in the Variable View, each row is representing a variable, and each column is acting as an attribute which is associated with the respective variable.

Entering Numeric Data

Entering Numeric Data

Entering String data:

  • In Data Editor you can enter the Non-numeric data like strings of text.
  • There is a Variable View tab in the window. Click and select.

Entering Numeric Data


Comments

Popular posts from this blog

Cross-tabulation and How to measure chi-square in SPSS

                                                                      Cross-tabulation   It is used to measure the relationship in two categorical variables. It is used to measure the chi-square test. For measuring the chi-square test there are two conditions: 1.Variables should be measured in nominal or ordinal level. 2. Variables should contain two or more categorical or independent groups. For example, to teach statistics for undergraduates,educators have to know their auidence(male,female) and which mode of learning they want(online,offline).So,here two nominal variables gender and medium of learning. Steps how to do chi-square in SPSS using cross-tabulation: Step1:  Referring to the above examples, two...

BASIC STATISTICS ---Mean,Median and Mode

MMEAN,MEDIAN AND MODE In order to summarize your data, you can do this using two methods : Graphs. Central Tendency methods. 1 . Graphs: Using various graphs we can easily summarize our data and get into the result. 2. Central Tendency Method: It represents the center point or typical value of dataset. It represents the data to cluster to a middle value.   Measures of Central Tendency I t can be measured through three different: 1. Mean 2. Median 3. Mode 1. Mean: It is one of the common central tendency method used.It can used for discrete and continuous data.It is given by sum of all values of dataset divided by number of values in the dataset. So if we have n values in dataset and they have values like x1,x2,x3,x4 etc.                                               Mean Formula – Example #1 Let say you have a data set with 10 data points and we want to cal...

Measurement Scales in SPSS

                                       M Measurement Scales in SPSS 1.Nominal: It is measurement scale in which numbers are used as "tags"or "labels" which is used to classify an object.It deals with non-numeric variables.It is used for the purpose of classification. for example, in case of gender scale,it can be classified as Male=1 and Female=2. It is used for only for counting purposes. 2.Ordinal: It is the second level of measurement in which ranking of data without actually establishing the degree of variation between them. Likert Scale through which we can measure the order. Scale: Divided into two parts: 1. Interval Scale 2. Ratio Scale 1.Interval Scale: In this measurement variables are measured in exact manner not in relative manner. Example: Likert Scale Net Promoter Score(NPS) Bipolar Matrix Table 2.Ratio Scale It allows researchers ...